

Why Does the Gold-to-Silver Ratio Matter for Wealth Protection?
The gold-to-silver ratio measures how many ounces of silver it takes to buy one ounce of gold at any given moment. It is one of the oldest benchmarks in precious metals markets — and one of the most misread.
Here is what it actually is: a barometer, not a trigger.
It does not predict where prices are going. What it does is show whether silver is historically cheap or historically expensive relative to gold right now. That distinction is the whole point.
The modern historical average sits between 50:1 and 60:1. For most of recorded monetary history, governments fixed it far lower — the classical bimetallic standard held it near 15:1 or 16:1. Geologists place the actual crustal abundance of silver relative to gold at approximately 17.5:1, which provides a rough physical baseline for the natural scarcity relationship between the two metals.
In practice, the ratio moves well beyond those anchors under financial stress. During the liquidity squeeze of March 2020, it spiked above 120:1 — an extreme reading with no modern precedent. In the commodity bull markets of 1980 and 2011, it contracted sharply, falling to near 17:1 and 30:1 respectively, as silver's relative value recovered.
Silver's role as both a monetary metal and an industrial material adds a layer the ratio alone does not fully capture. Industrial applications account for more than 50% of annual global silver consumption. A persistent supply deficit — driven by declining mine output colliding with record industrial demand — creates structural pressure beneath the price surface that the ratio reflects but does not explain on its own.
Understanding what the ratio means — and what it does not — is the starting point for anyone who wants to make calm, informed decisions about physical silver ownership.
- What the Gold-to-Silver Ratio Actually Measures
- Why the Ratio Fails as a Day-Trading Signal
- What Drives the Ratio Higher — and What Eventually Brings It Back
- How Retirement Owners Use the Ratio Strategically
-
Frequently Asked Questions
- What is the historical average of the gold-to-silver ratio?
- How does a high gold-to-silver ratio signal that silver is undervalued?
- Can I use the gold-to-silver ratio to rebalance my precious metals IRA?
- Why does the gold-to-silver ratio typically widen during periods of high economic uncertainty?
- Does an expanding gold-to-silver ratio mean gold is overvalued, or that silver is undervalued?
- Does Brighton Gold provide advice on when to buy silver based on the ratio?
- The Barometer Reading: What to Do With What You Now Know
What the Gold-to-Silver Ratio Actually Measures

The gold-to-silver ratio is division. Take the current price of gold, divide it by the current price of silver, and you get a single number — how many ounces of silver one ounce of gold can buy today.
But it isn't really a price. It's a relationship — a live reading of how far silver has drifted from gold in the market's collective judgment about relative value. That relationship is the starting point for every informed decision you'll make about physical silver ownership.
Think of it as a barometer, not a trigger. A barometer doesn't tell you to carry an umbrella. It tells you what atmospheric pressure is doing right now. The ratio works exactly the same way — it describes conditions. What you do with that reading depends on what you're trying to protect and over what time horizon.
The Simple Math Behind the Number
The math isn't complicated. If gold trades at $3,000 per ounce and silver trades at $30 per ounce, the ratio is 100:1 — it takes 100 ounces of silver to equal one ounce of gold. If silver climbs to $60 while gold holds steady, the ratio drops to 50:1. No forecasting. No models. Just two prices divided by each other.
The significance is in what that number looks like against centuries of context — and understanding the gold-to-silver ratio means holding three very different benchmarks in your head at once. The modern average sits between 50:1 and 60:1. The classical bimetallic standard — when both metals backed currency — held near 15:1 or 16:1. Geologists put Earth's natural crustal abundance of silver relative to gold at roughly 17.5:1. The physical world, monetary history, and modern markets aren't telling the same story. That gap is the whole point.
Why the Ratio Has Shifted So Far From Its Historical Baseline
The ratio didn't drift from 16:1 to 50:1 — or higher — because silver got scarcer in the ground or gold became more useful. It shifted because the paper markets decoupled from the physical reality that originally anchored both metals.
When governments abandoned the bimetallic standard, they removed the fixed anchor. The ratio became free to float — and float it did. Markets began pricing silver not just as money, but as an industrial input, a speculative vehicle, and a secondary consideration after gold when financial fear takes over. Each of those roles pulls the ratio in a different direction depending on the moment. You can trace the full span of that drift in historical gold-to-silver ratio data, which charts over a century of daily readings.
The result is a ratio that reflects neither nature nor monetary history. It reflects sentiment. And sentiment overcorrects — in both directions. When fear spikes, the ratio widens sharply as capital abandons silver and crowds into gold. When confidence returns and commodities recover, it contracts just as fast. That oscillation between extremes is exactly why calm, patient owners who understand what they're looking at can use this ratio as a signal — not a trigger, not a reason to panic, but a clear barometer reading of where relative value sits right now.
| Era / Reference Point | Approximate Ratio | What Governed It |
|---|---|---|
| Classical Bimetallic Standard | ~15:1 or 16:1 | Government-fixed exchange rate between gold and silver backing currency |
| Earth's Crustal Abundance | ~17.5:1 | Natural geological scarcity relationship between silver and gold in the Earth's crust |
| Modern Market Average | 50:1 to 60:1 | Free-floating paper markets pricing both metals after the bimetallic standard was abandoned |
Why the Ratio Fails as a Day-Trading Signal
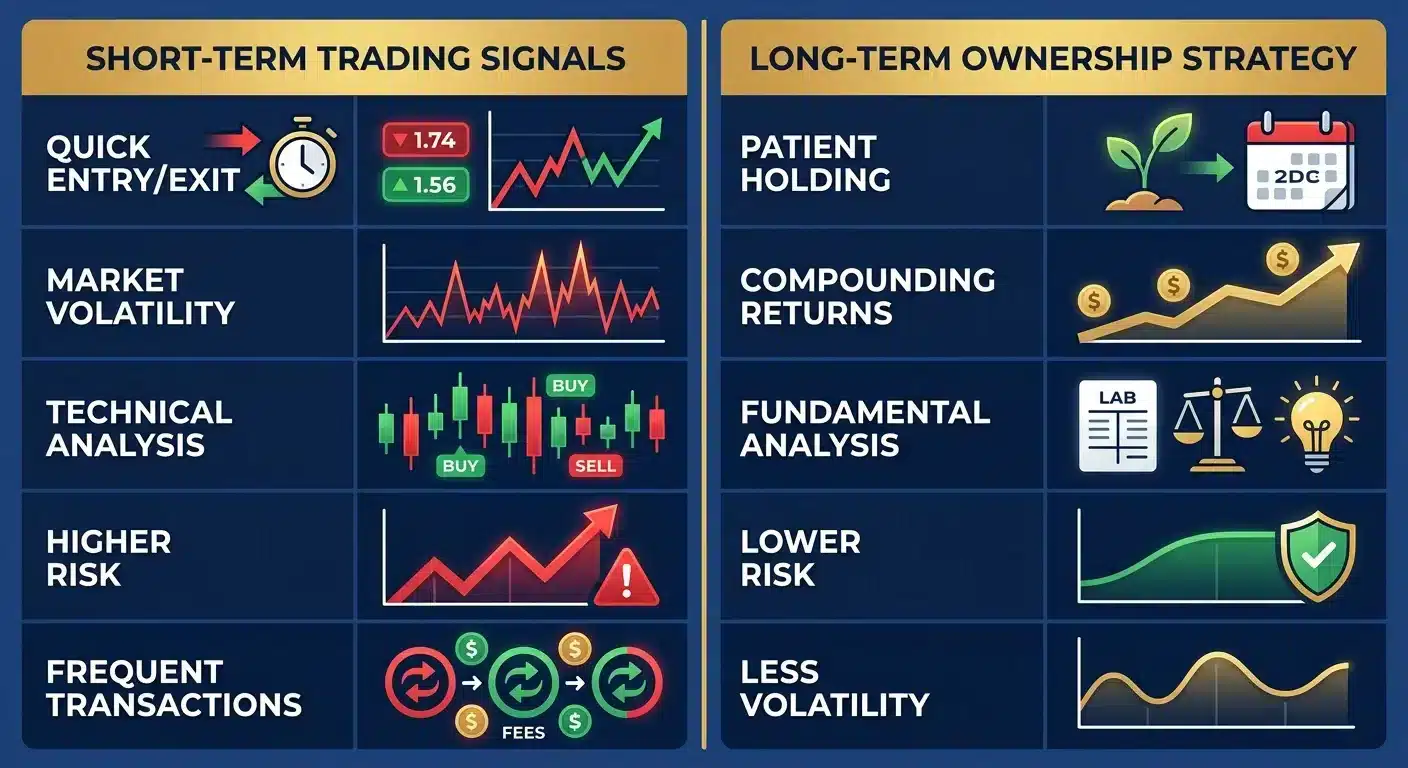
Here's where most ratio content goes wrong.
It gets packaged as a trading trigger — a flashing number that tells you when to swap metals, when to buy, when to get out. That framing isn't just inaccurate. It's the wrong instrument applied to the wrong problem.
The ratio moves slowly. It doesn't reverse in a day, a week, or a month.
The spike above 120:1 in March 2020 took years to fully unwind. The modern average — sitting between 50:1 and 60:1 — isn't a ceiling that triggers a pop when it's crossed. It's a center of gravity the ratio drifts toward over long cycles.
Check a barometer every hour and reroute your plans with each reading — you're not prepared. You're reactive. That's not what the instrument is for.
The ratio rewards patience. Full stop.
Owners who get that don't react to every widening spread. They recognize when conditions are historically favorable for accumulating physical silver — and they move with deliberate calm, not urgency.
The Industry Method Brighton Gold Rejects
There's an entire industry built around ratio trading — swapping gold for silver when the ratio widens, swapping back when it contracts, chasing the spread between two metals as if they were equities on an exchange.
This is the approach Brighton Gold rejects. Not because the math is wrong. Because the underlying model treats physical metals as paper instruments — and that confusion has real costs.
Ratio trading racks up transaction costs, custodial friction, and tax events with every swap. And it demands accurate timing in a market that has repeatedly proven the ratio can stay at extreme levels far longer than any model expects.
The 2020 spike above 120:1 didn't snap back. It lingered. Anyone who bought silver expecting a fast contraction found themselves months in — capital committed, ratio still elevated, no exit on the horizon.
That's not wealth protection. That's speculation wearing a metrics framework as a costume.
Our view — applied consistently across every silver coins vs silver bars conversation we have with customers — is that the ratio is most useful as a long-horizon context indicator.
When it's reading well above the modern average of 50:1 to 60:1, that's worth noting. When it's near historical extremes, that's a condition worth understanding.
Neither one is a command.
Who This Kind of Ratio-Reading Is Not For
Worth saying plainly: if you're approaching the gold-to-silver ratio as a short-term arbitrage tool — buying and selling physical metals to capture spread movements — Brighton Gold isn't the right fit.
We don't provide market timing guidance. We don't forecast when the ratio will contract or by how much.
No one can. Anyone who says otherwise isn't offering analysis — they're applying pressure.
The ratio has held above its modern average for extended stretches. It's contracted sharply at others. That range is wide enough to make short-term ratio plays genuinely speculative, regardless of how they're framed.
What Brighton Gold is built for is the customer accumulating physical silver strategy for the long term — someone whose goal is holding something real, not executing a trade.
For that customer, the ratio becomes genuinely useful. Not as a trigger. As one clear signal among several that helps you recognize when conditions favor meaningful accumulation.
That's the whole distinction. The difference between reacting to a number and understanding what that number is actually telling you.
| Approach | What It Promises | What It Actually Delivers | Who Benefits |
|---|---|---|---|
| Ratio trading (swap gold for silver when ratio widens, swap back when it contracts) | Capture the spread between two metals and grow total ounces over time | Transaction costs, custodial friction, and potential tax events with every swap — plus extended periods where the ratio stays elevated far longer than expected | Brokers and dealers who earn a spread on every transaction |
| Short-term ratio timing (buy silver when ratio spikes, sell when it contracts) | A reliable buy/sell signal that generates near-term gains from ratio normalization | Speculative exposure to a slow-moving indicator that can hold extreme readings for months or years — rewarding patience, not speed | Platforms and commentators selling urgency-driven market entry frameworks |
| Long-horizon context reading (use the ratio as one signal among several for deliberate accumulation) | A clearer picture of when physical silver represents historically favorable relative value | Calm, informed accumulation of high-liquidity physical metals during conditions that favor silver — without manufactured urgency or transaction churn | Retirement-aged owners focused on long-term wealth protection and physical ownership |
What Drives the Ratio Higher — and What Eventually Brings It Back
What actually moves the ratio? And what eventually pulls it back?
Those are the two questions worth answering before any ratio reading means anything to you.
Here's the short version: the ratio rises when fear drives capital into gold and exits silver. It falls when industrial demand, commodity confidence, and physical accumulation pull silver back toward its natural relationship with gold.
But the short version leaves out the part that matters. The mechanisms behind each direction are what tell you whether an elevated reading is a temporary sentiment spike — or a structural dislocation that takes years, not weeks, to resolve. Those are very different situations requiring very different thinking.
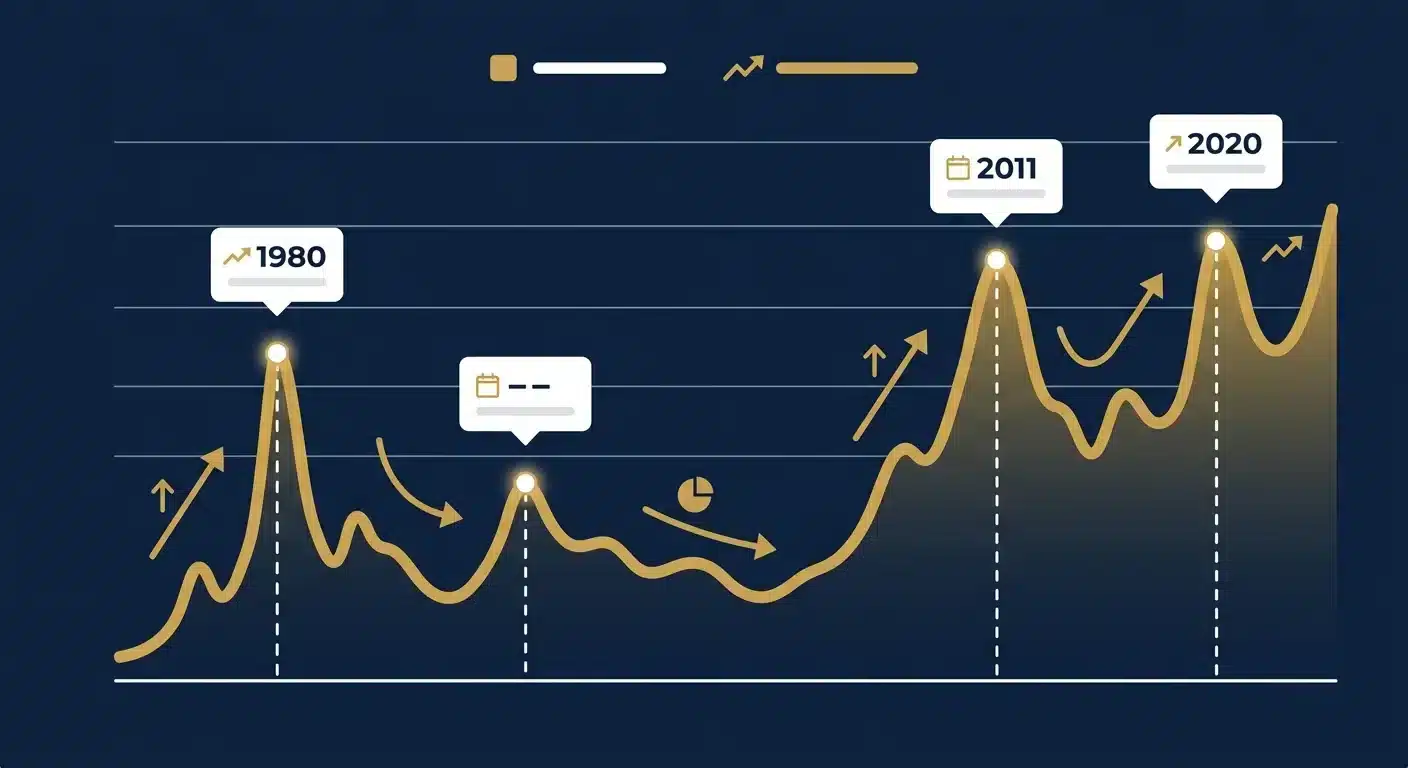
The extreme readings weren't random. The spike past 120:1 in March 2020, the contraction to near 17:1 in 1980, the compression to near 30:1 in 2011 — each one followed a recognizable set of conditions.
That's the point. Calm, patient owners who understand those conditions don't need to react to a number. They already know what the number is telling them.
The Forces That Push the Ratio to Extremes
Financial crises and liquidity squeezes push the ratio to its most extreme readings. Here's why.
When markets seize and institutional investors need to raise cash fast, silver gets sold first. It's more thinly traded than gold. It carries heavier industrial associations in the market's mind. And it doesn't have gold's centuries-deep reputation as the universal monetary anchor.
So capital rushes into gold and exits silver simultaneously — gold holds or climbs while silver's price compresses. That's the dynamic that drove the ratio above 120:1 during the liquidity shock of March 2020.
Broad commodity bull markets produce the opposite. When economic confidence expands and industrial demand accelerates, silver tends to outrun gold — its price moves faster in both directions.
That compression drove the ratio down to near 17:1 at the 1980 commodity peak and near 30:1 at the 2011 top. In both cases, silver's dual role — monetary metal and essential industrial input — amplified the move well beyond what gold alone would have produced.
The pattern holds consistently across historical gold-to-silver ratio data: extreme ratio readings cluster around moments of maximum fear or maximum confidence. Both are temporary conditions.
The ratio doesn't hold at 120:1 forever. It doesn't stay near 17:1 indefinitely either. What it does is oscillate — sometimes slowly, sometimes sharply — around a center of gravity anchored in structural realities beneath the sentiment.
Reading that oscillation accurately is the skill worth developing. Not to time a trade. To recognize the conditions.
Why Silver's Industrial Demand Creates a Different Kind of Floor
Here's what makes silver's dynamics fundamentally different from gold's.
Industrial application accounts for more than 50% of all annual global physical silver consumption, according to global silver demand trends. Gold's primary role is monetary and reserve-related. Silver has to serve two masters — monetary store of value and essential industrial input — and that dual demand structure creates a floor beneath its price that exists entirely independent of financial sentiment.
That floor isn't guaranteed to hold at any specific price level. But a persistent structural supply deficit — declining mine output colliding with record industrial demand — creates ongoing fundamental pressure that paper sentiment can temporarily overwhelm but can't permanently suppress.
When the ratio widens sharply during a fear event, industrial demand doesn't disappear. The geological gold and silver statistics make this clear: silver's physical scarcity is real. It isn't a sentiment story. It's geology.
That's why a high ratio reading deserves real attention — not as a trading signal, but as a lens for thinking about long-term physical ownership. It's the same lens we apply at Brighton Gold when customers ask about which formats deliver the best combination of liquidity and lasting value.
The ratio doesn't tell the whole story. But when sentiment-driven fear has pushed it well above historical norms while a structural supply deficit quietly persists beneath the surface, the barometer is showing something worth reading.
Not urgently. Carefully.
| Ratio Cycle Phase | Approximate Ratio Range | Primary Driver | What Followed |
|---|---|---|---|
| 2020 Liquidity Squeeze Peak | Above 120:1 | Institutional panic selling of silver; capital flight into gold during market seizure | Ratio compressed sharply over subsequent months as fear subsided and silver demand returned |
| 1980 Commodity Bull Market Trough | Near 17:1 | Broad commodity confidence surge; silver's dual monetary and industrial role amplified the move | Ratio expanded again as the commodity cycle peaked and economic conditions normalized |
| 2011 Commodity Bull Market Trough | Near 30:1 | Renewed physical accumulation and accelerating industrial demand pulled silver sharply higher relative to gold | Ratio widened again in the years following as commodity cycle momentum faded |
| Structural Supply Deficit Phase (Ongoing) | Elevated above modern average | Record industrial demand colliding with declining mine output — over 50% of silver consumed annually by industrial fabrication | Fundamental supply pressure persists beneath paper sentiment; ratio elevated readings create accumulation context for long-term owners |
How Retirement Owners Use the Ratio Strategically

Knowing what the ratio measures is the easy part. Knowing what to do with a high reading — without turning it into a trade — is where most people get stuck.
The answer isn't a formula. It's a posture.
The ratio doesn't tell you what silver's price will do next week. It tells you something more useful: where silver stands, historically, relative to gold right now.
When that reading is elevated — well above the modern average of 50:1 to 60:1 — it signals that physical silver is offering more ounces per gold-equivalent dollar than historical norms suggest is sustainable. That's not a forecast. It's a condition.
And conditions are what patient owners act on.
The retirement owners Brighton Gold works with aren't trying to capture a spread. They're acquiring meaningful physical silver at favorable terms — and then holding it.
So the ratio becomes a quiet checkpoint, not a loud alarm. When the barometer shows elevated pressure, you take note. You don't panic. You don't sprint.
You act with the kind of deliberateness that protects wealth over decades, not quarters.
Reading the Ratio Without Forecasting a Price
Here's a distinction that matters: reading the ratio and forecasting off it aren't the same thing.
Reading it means recognizing where the ratio sits relative to its historical range — and asking whether conditions make physical silver accumulation particularly favorable right now. Forecasting means predicting when and how far the ratio will contract.
One is useful. The other is speculation.
The ratio has contracted from major peaks before — from near 17:1 in 1980 and near 30:1 in 2011. Neither contraction arrived on anyone's schedule.
Waiting for a specific level before accumulating, or holding off because you expect a further widening — that puts you in the forecasting business. And that's not where this instrument earns its value.
It's not the framework we'd recommend to anyone building long-term physical silver ownership.
Some customers ask directly: if silver swings this dramatically in both directions, isn't it too volatile for a retirement context?
That's a fair concern. It deserves a straight answer, not a dismissal.
Volatility shapes how you think about position sizing, product selection, and the role physical silver plays alongside gold in a long-term ownership picture. Reading the ratio without understanding that volatility is reading it blind. That's exactly what we cover in depth at Silver's volatility profile in retirement
Choosing the Right Physical Products When the Ratio Is Elevated
When conditions favor accumulation, product selection isn't a detail. It's the decision.
Not all silver products carry the same liquidity, premium structure, or long-term resale profile — and those differences compound over time in ways that matter far more than the initial spread.
For retirement owners focused on long-term ownership and clean resale, liquid U.S.-minted silver coins consistently offer the most transparent value. Sovereign government backing. Precise weight and purity specs. Broad secondary market recognition.
And here's what the product conversation sometimes misses: industrial application drives more than 50% of all global annual silver consumption. Physical silver's underlying demand isn't a sentiment story — it's structural.
But structural demand doesn't rescue a product that's difficult to sell when you need to. Liquidity matters as much as the metal itself.
The silver coins vs silver bars question comes up consistently when the ratio makes accumulation feel timely. The answer depends on what you're optimizing for.
Coins carry higher per-ounce premiums but offer flexibility in smaller increments and frictionless resale. Bars deliver more metal per dollar at scale — but can introduce friction at resale depending on the buyer and format.
When the barometer is showing a historically elevated ratio, the goal is accumulating quality physical silver with high long-term liquidity. Not chasing the lowest premium at the expense of everything else that makes ownership practical. That distinction is what separates a strategic accumulation decision from a transaction.
| Ratio Signal Range | General Interpretation | Physical Product Consideration | Liquidity Note |
|---|---|---|---|
| Well below historical modern average — historically compressed range | Gold is offering relatively more value per ounce; silver's relative purchasing power is elevated against gold; conditions favor gold accumulation or holding existing silver | Maintain existing physical silver positions; gold-equivalent purchases carry favorable terms at this reading | High — compressed ratios typically accompany broad commodity confidence; secondary market for both metals tends to be active and transparent |
| Near the modern historical average — mid-range reading | Neither metal signals a dramatic relative discount; ratio is oscillating around structural norms; no strong directional signal in either direction | Continue systematic accumulation based on long-term ownership goals rather than ratio timing; product selection should emphasize liquidity over premium optimization | High — mid-range conditions reflect balanced market sentiment; sovereign U.S.-minted coins and recognized bullion bars both carry reliable secondary market access |
| Elevated above historical modern average — ratio widening meaningfully | Physical silver is offering more ounces per gold-equivalent dollar than historical norms typically sustain; paper sentiment may be suppressing silver's relative price; conditions warrant careful attention | Favor high-liquidity physical silver products — sovereign U.S.-minted coins offer the most transparent value proposition; prioritize resale flexibility over chasing the lowest per-ounce premium | Prioritize products with broad secondary market recognition; coins in standard government-issued sizes consistently outperform specialty or lower-recognition formats at resale |
| Extreme historical reading — ratio well above sustained modern norms | Likely reflects a liquidity-driven fear event or systemic dislocation rather than a fundamental revaluation; silver's structural demand picture has not changed; extreme readings have historically been temporary | Accumulate physical silver with discipline and patience — not urgency; focus on sovereign bullion products with the highest liquidity and widest recognition; avoid specialty or limited-mintage formats that carry premium risk at resale | Liquidity is paramount at extreme readings; sovereign government-backed coins from recognized mints carry the most transparent resale profile across a wide range of secondary market conditions |
Frequently Asked Questions
Good frameworks raise good questions. Here are the ones that come up most.
These come directly from customers who are past the 'should I consider silver' stage and are thinking through the specifics.
What is the historical average of the gold-to-silver ratio?
That depends on which era you're measuring.
Under the bimetallic standard that governed U.S. monetary policy through much of the 19th century, the ratio was fixed near 15:1 or 16:1. That was a political decision — not a market one. Congress set the number. The market didn't.
In the modern era — roughly the past 50 years — the working average has run between 50:1 and 60:1. For anyone thinking about today's conditions, that's the relevant benchmark. The old bimetallic number is useful context for understanding how far markets have drifted from the original physical anchor. But it's not a realistic target to plan around.
How does a high gold-to-silver ratio signal that silver is undervalued?
The ratio doesn't declare silver undervalued. It describes a condition.
When it sits well above its modern average of 50:1 to 60:1, you're getting more ounces of physical silver per gold-equivalent dollar than history suggests is stable. That's a favorable condition for accumulation — not a price forecast, not a guarantee that silver closes the gap on any specific timeline.
But when that condition pairs with a structural supply deficit and persistent industrial demand, the barometer is reading something more than sentiment. That combination is worth paying attention to. Calmly — not urgently.
Can I use the gold-to-silver ratio to rebalance my precious metals IRA?
That's a question for your CPA or a licensed financial advisor. Brighton Gold doesn't provide financial, tax, or legal advice — and we won't frame things as if we do.
What the ratio can do is inform your thinking. Owners who already hold both metals sometimes use a significantly elevated ratio as a signal to direct more of their next acquisition toward silver rather than gold. That's a logical, conditions-based approach.
Whether it fits your specific retirement account structure is a decision that belongs to you and your qualified advisor. We can give you the clearest possible picture of the conditions. The decision is yours.
Why does the gold-to-silver ratio typically widen during periods of high economic uncertainty?
When fear spikes, capital moves fast — and it moves toward gold first. Gold is perceived as the more liquid, more universally recognized monetary metal. Institutions reach for it immediately. Silver gets sold alongside industrial and risk assets.
Gold rises. Silver drops. The ratio widens — sometimes dramatically. In March 2020, that dynamic drove the ratio above 120:1, its highest modern reading on record.
The fear event distorts the ratio well beyond what fundamentals support. But the distortion doesn't hold. Structural silver demand doesn't disappear because sentiment is running hot. The fundamentals are still there. The barometer just took an extreme reading.
Does an expanding gold-to-silver ratio mean gold is overvalued, or that silver is undervalued?
Usually both — but that framing misses the point.
An expanding ratio means the relationship between the two metals has moved outside its historical norm in gold's favor. That's a relative value condition. It doesn't mean gold has no further room. It doesn't mean silver is guaranteed to recover.
What the historical record does show: when the ratio has contracted from major peaks — near 17:1 in 1980 and near 30:1 in 2011 — it's been silver catching up, not gold collapsing. Think of it as a relative value signal. Rendering a verdict on either metal in isolation is the wrong way to use this tool.
Does Brighton Gold provide advice on when to buy silver based on the ratio?
No — and we're direct about that because it matters. Brighton Gold doesn't forecast silver prices, time the market, or tell customers when to buy. That's not what we do, and it's not what we'd trust anyone else to do reliably either.
What we do is help customers understand the conditions — historical ratio ranges, structural supply dynamics, product selection, liquidity considerations — so they can have an informed conversation with their financial advisor and make a decision that fits their situation.
If you're looking for someone to tell you the ratio is about to contract and that the window is closing, we're not the right fit. If you want clear information so you can think through the decision yourself, that's exactly what a complimentary consultation with Brighton Gold is built for.
The Barometer Reading: What to Do With What You Now Know
A barometer doesn't tell you when to leave the house. It tells you what the pressure is — and people who know how to read one know what to do next.
The gold-to-silver ratio works exactly the same way.
When the reading is elevated well beyond historical norms, that's information. Not a command. Not a crisis signal. Information that calm, patient owners can act on — without urgency, without guesswork, without needing the barometer to tell them everything.
Here's what Brighton Gold has seen, consistently: the owners who make the most confident physical silver acquisitions aren't the ones who waited for a perfect signal.
They're the ones who understood the conditions — the structural supply deficit, the dual demand dynamic, the historical oscillation between extremes — and moved with a framework instead of a forecast.
The ratio gave them something to work with. They didn't need it to hand them certainty.
So here's where this lands.
If the ratio is running at historically elevated pressure right now, that's a condition worth taking seriously. Not because silver is guaranteed to move. Not because there's a clock ticking. But because physical silver — accumulated at favorable relative terms, held in sovereign U.S.-minted form, with real long-term liquidity — is the kind of tangible ownership that conservative retirement holders build lasting security on.
When you're ready to Buy Silver with that framework in mind, the ratio isn't a prediction. It's a barometer, not a trigger — and knowing how to read it calmly, clearly, without letting sentiment run the decision, is what separates strategic owners from reactive ones.
That's the conversation Brighton Gold is glad to have.
The ratio is telling you something. Whether it fits your situation is a different question — and that's exactly what a complimentary consultation with Brighton Gold is built to answer. How the No Fee IRA works. What product options make sense at current ratio levels. What questions to bring to your financial advisor. No forecast. No pressure. Just the clearest picture we can give you.